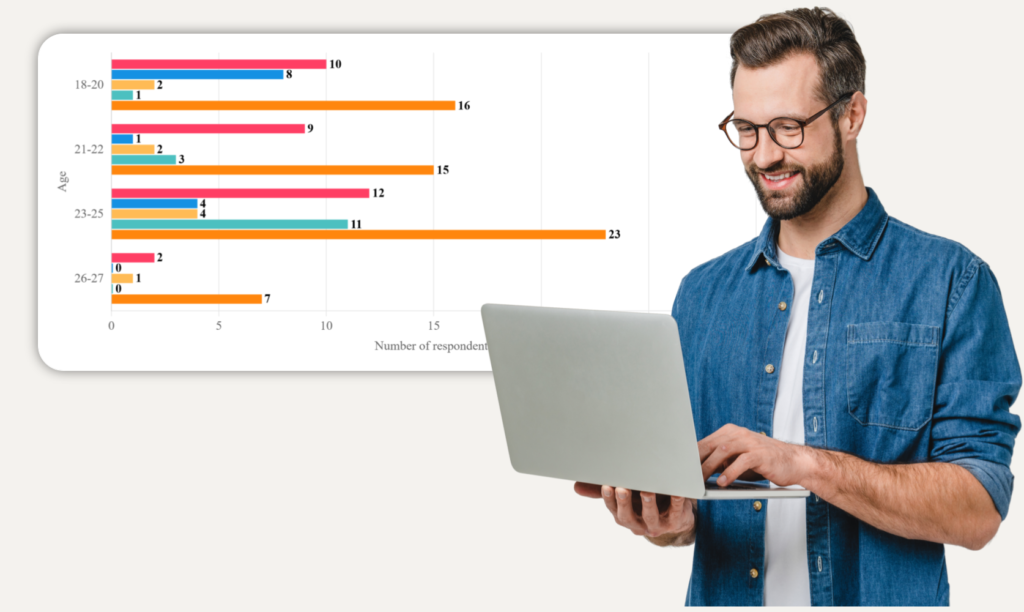
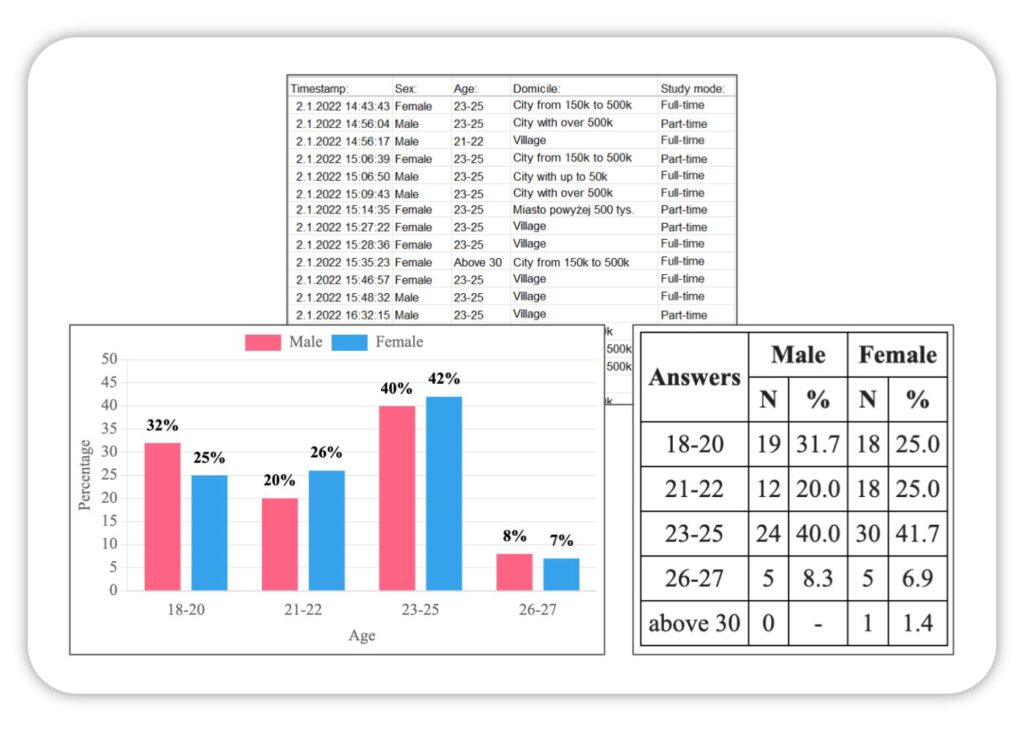
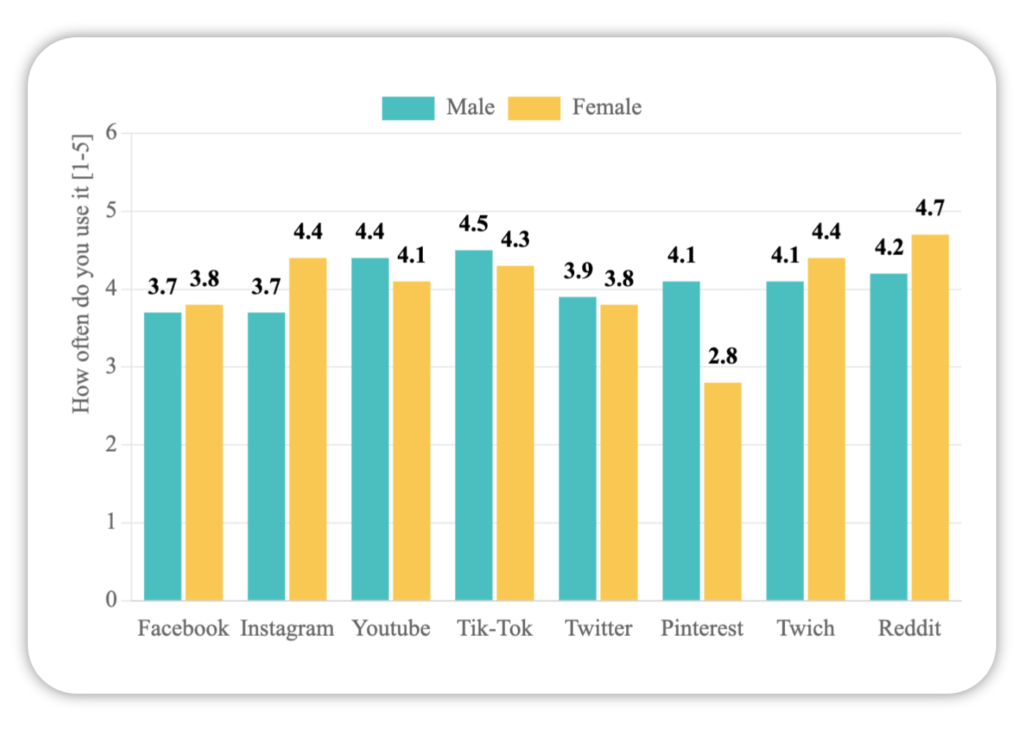
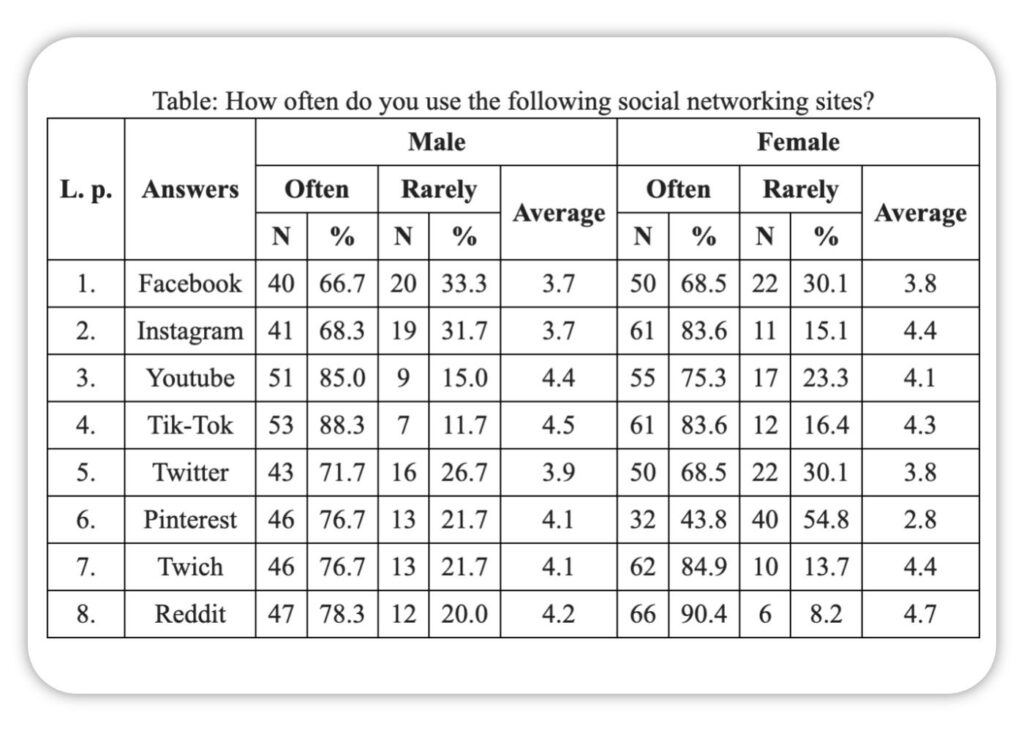
Tables and charts from survey results
With just a few clicks, process data directly from Google Forms, Microsoft Forms, or any Excel sheet
Analysis of survey results
How does it work?
1. Upload a file with survey results
Simply download a .csv file directly from your Google Forms results or load an Excel file in a compatible format.
2. Perform statistical analysis on part of the data
You get access to the development of each question, including the first 25 answers in the file. Customize data, correct answers, generate charts and tables.
3. Create a survey report
If the app meets your needs, purchase the full version, which includes all the answers in the file. Paste ready-made tables and charts into the text of your work.
Graphical presentation of statistical data
Choose how you will present your data
Choose the type of chart
Pie, bar, or maybe horizontal?
Set the colors
You can use a ready-made palette or choose each color individually
Position the legend and axis labels
Your supervisor probably wants the axes labeled…
Download the ready chart
Save the chart on your computer and insert it into the text of your thesis.
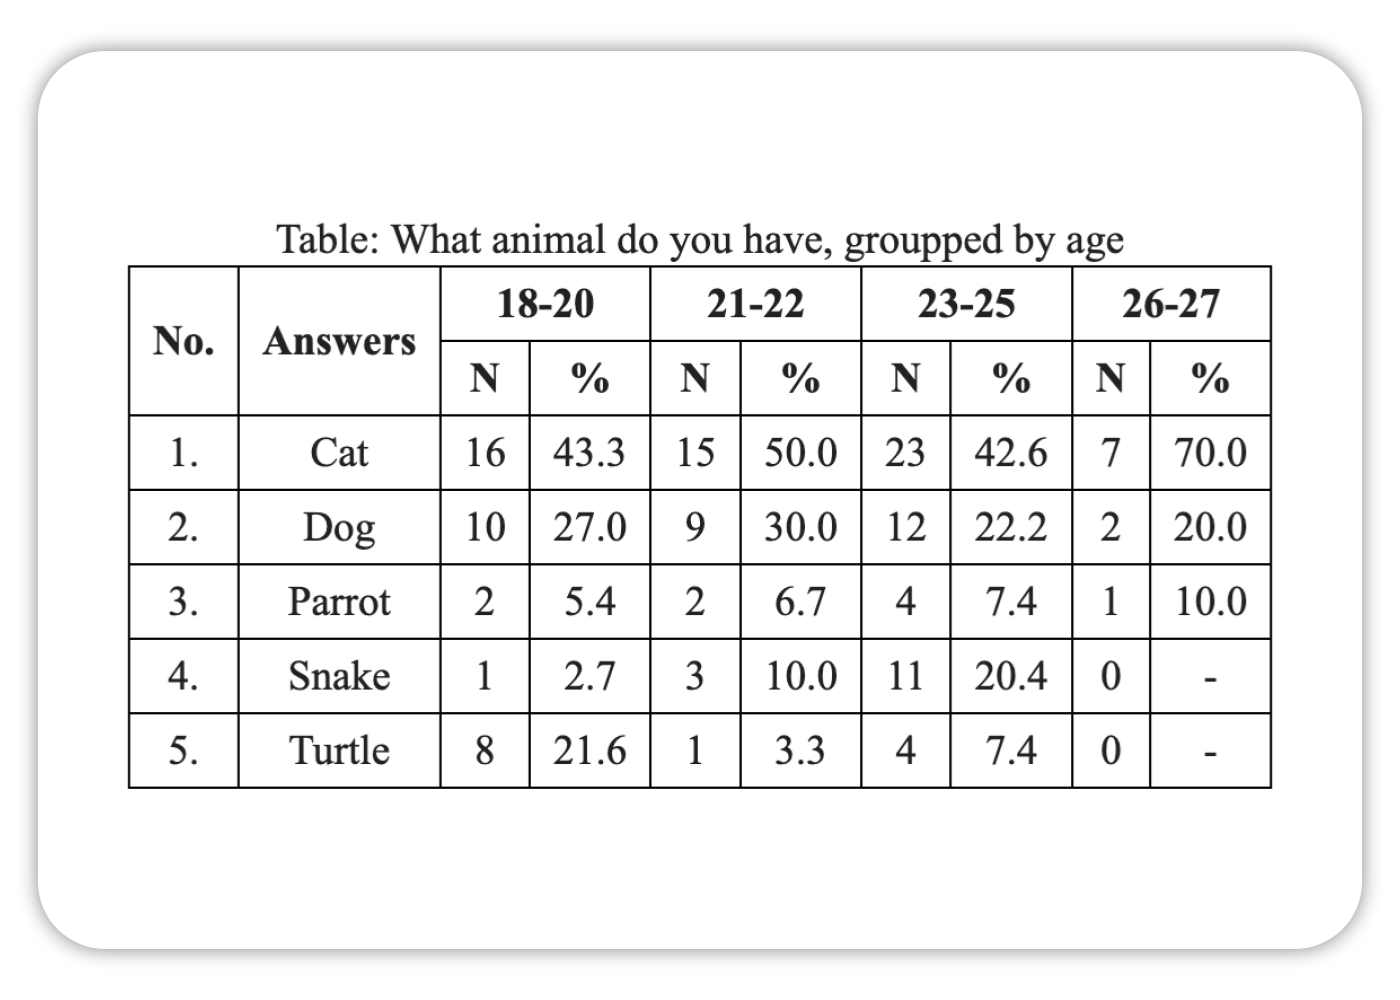
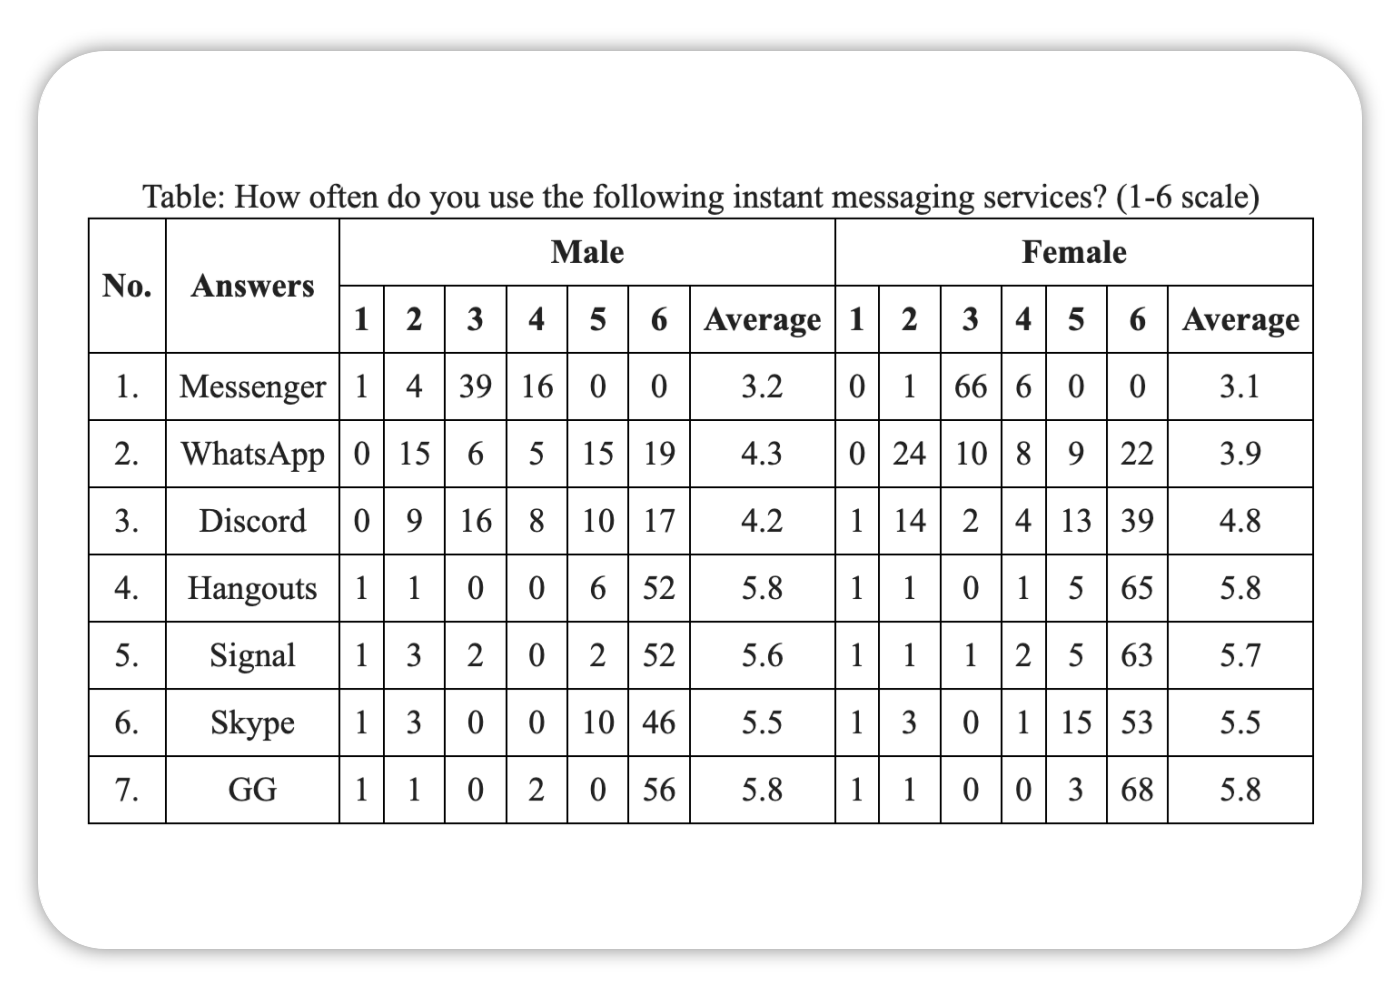
Create summary tables
Count the answers, calculate percentages and averages, sort the results, divide into groups
Customize answer text
Did you edit the survey midway? Some Rarely are written with lower case? Correct typos, complete or eliminate omissions.
Choose which columns to show
Add an ordinal column, a column with the percentage of a given answer, a column with the average. Break into separate tables for each group
Set the appearance of the table
Select font size, margins, widths. Customize column headings, arrange answers in the table. Sort by number of responses.
Copy and paste into Word, Excel, etc.
Paste the ready table into your text work – it will be imported as if it were a table created in Word.
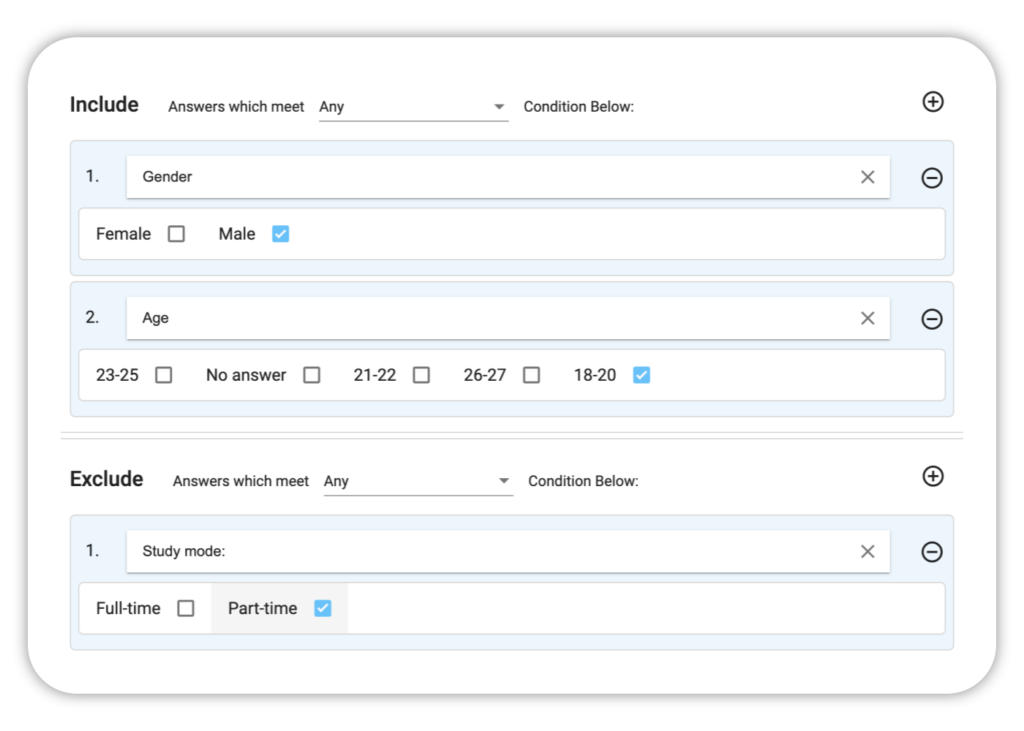
Filter answers before analysis
Include or exclude responses for analysis
Perform separate analyzes for any selected group with any number of conditions, e.g. Show summary for Women, aged 18-20, from a small village, full-time students.
Save filters for later
Switch between saved filters
Examples of tables and charts


Follow us on FB
Polecam
Do tego obsługa na medal! Pomimo że była niedziela popołudniu od razu dostałam nowy dostęp do mojej ankiety (zapomniałam jednych danych uzupełnić w pliku), a po tym kolejny, gdy okazało się, że machnęłam się przy wysyłaniu tego pliku (ach, te „nowe”, „najnowsze”, „prawidłowe” pliki, kto pisze ten pewnie wie 😂)
Także jednym słowem warto!
See how Tabledo works
Have doubts or questions?
Check out the description of all features or visit our FAQ page